1. Current comparison entry points
| Experiment | Report | What is timed |
|---|---|---|
| 256 MiB, WriteSession, empty callback | Session | Producer submission, including session acquisition and switching |
| 256 MiB, ordinary write, maximum publish count | Block-handoff publication | Producer submission, including block acquisition and switching |
| 256 MiB, ordinary write, publication every record | Per-record publication | Producer submission, including publication |
| Continuous message batches, each starting empty | Business performance after a batch | Business execution immediately after sending; ratio to normal business cost |
| Earlier experiment: prepared message backlog | Prepared-backlog business execution | Same business workload with approximately 198–205 MiB pending |
The first three reports use three independent runs, callback loop count 0 and one common block configuration per report across 8/16/32/64 B. Configuration selection uses the stated 35% throughput, 30% p50, 20% p99 and 15% p999 weights. The current business experiment starts every batch empty and uses regular upstream SPSC APIs with fixed callback work. Business p50 reflects 16-call group means; the write reports use 1,000-write group means. The two business reports have different initial backlog states.
All initialization parameters are disclosed in each report. The saved configuration and complete set of runs, rather than a selected best run, define each experiment. Historical report notes and test catalogs retain their original Chinese; current guides and the four main reports have separate English and Chinese reading pages. Numerical evidence and original commands are preserved.
2. Business performance after continuous sending
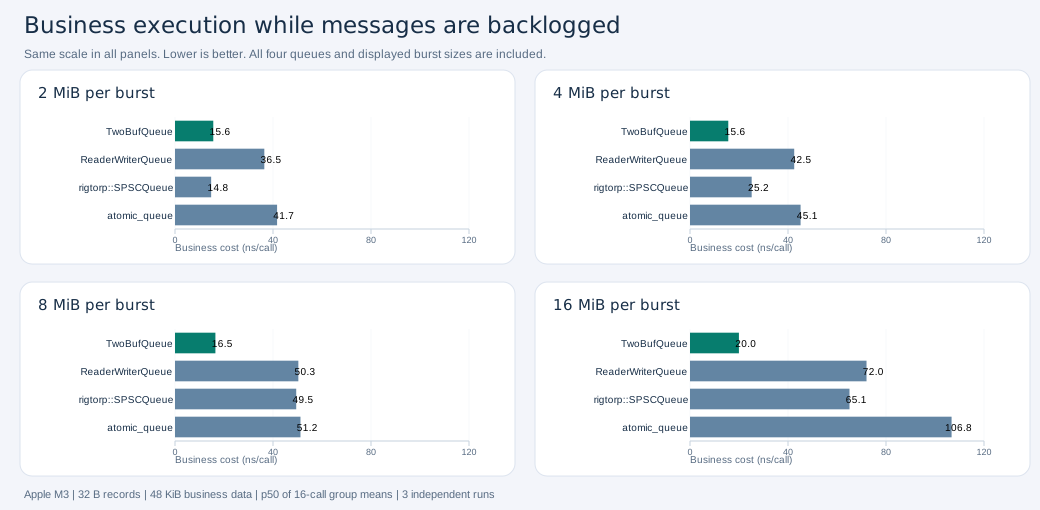
Flow: normal business execution → continuous message batch → immediate business execution. Each batch starts with zero pending messages, consumers stay active, and draining happens outside timing. The setup uses 32 B messages, a 48 KiB business working set, 64 callback iterations, a 16 KiB TwoBufQueue source pool and 256 MiB output/native capacity. Every 2/4/8/16 MiB size has three independent runs, 2,500 windows and 10,000 business timing groups per run. Full invariant and sample verification.
The current table reports post-send business p50: time 16 business calls per group and divide by 16, calculate p50 independently for each run, then average three runs. The normal reference comes from the same no-queue control and is about 13 ns/call on this host; every ratio is post-send cost divided by 13 ns. Charts, README and report all use the same complete result, without reselecting trials.
Source and output budgets are counted separately; consumers and copy workers continue running. Pending messages accumulate naturally after each batch, without preparing an initial backlog of approximately 200 MiB. The old 80% prefill rule belongs only to the historical prepared-backlog experiment; its figure and original results remain available.
From the project root, replay the current fixed workload or regenerate its figure:
python3 benchmarks/burst/run_burst_empty.py --profile docs/performance_data/burst_from_empty_20261013/selected_config.json
python3 -m pip install reportlab==4.4.9
python3 tools/plot_burst_release.py
The plot command reads saved results and updates docs/assets/burst_business_cost.svg and its numeric JSON; it does not run performance tests. The original measurements and their hashes remain unchanged.
Run the batch/business experiment · Search writer configurations · Browse all published reports.
3. Compressed evidence
The release exporter retains original measurements byte for byte inside deterministic gzip files when they exceed 1 MiB. HTML and Markdown evidence links in the release copy point to the compressed files. compression-manifest.json records both original and compressed SHA-256 hashes. To restore the recorded file paths without overwriting different existing files:
python tools/unpack_performance_data.pyThe original development directory remains unchanged by export. Source/executable archives and original absolute command paths are evidence of the measurement host; use the portable benchmark runners to measure another host. Publication packaging and compression do not create new benchmark results.
4. Historical matched measurements
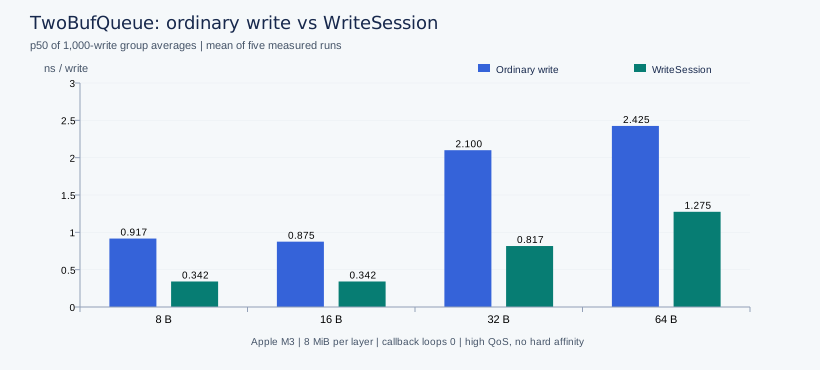
The historical producer-write chart uses the saved 2026-10-11 post-fix matched-parameter experiment, not newly selected best results. Both ordinary write and single-block Session use the same block sizes, pool limits, publication settings and read configuration for each payload length. Throughput and latency use the same configuration; the results are not claimed to be global optima.
The saved f698f25 experiment retains every formal run. The chart and main table do not substitute selected best trials.
| Condition | Ordinary write | WriteSession |
|---|---|---|
| 8 MiB per layer, callback iterations 0 | Historical report (Chinese) | Historical report (Chinese) |
| 256 MiB per layer, calibrated callback work | Historical report (Chinese) | Historical report (Chinese) |
5. Historical ordinary-write scan-current run
A separate ordinary-write run uses is_scan_current=true, 1 ms initial/maximum scan intervals and minimum wait, and publish_count=10. Each entry sends 10 million messages with five throughput and five group-latency runs; all 320 formal measurements and 32 full-payload/FIFO validations passed. Callback iterations remain 1/1/2/4 at 256 MiB and 0 at 8 MiB to isolate the read/publication change; they were not recalibrated to a 2–3 ratio. Native SPSC controls were remeasured in that batch.
Ordinary-write links in the historical four-report table above point to this run, while Session reports retain the preceding batch. They are therefore no longer a same-parameter, same-batch control. The historical write-cost figure still uses the matched scan-disabled, UINT32_MAX-publication experiment described below; it contains no mixed-in new data. Old report backups stay in the development directory. Use each published report's saved configuration to interpret its metrics.
Raw data for this run · Environment and source hashes · Source snapshot · Post-run audit. The methodology and historical experiments below use their own saved settings; this batch changes the scanning/publication settings described above.
6. Previous matched experiment scope
- Apple M3, 8 GiB RAM, macOS 14.4.1 arm64, Clang 18.1.8, optimized unsanitized Release, AC power. Producer high QoS; no hard affinity. Other platforms must be measured independently.
- 8/16/32/64-byte payloads; 10 million successful writes per formal run, five throughput runs and five latency runs per entry. Input is prepared before timing and every message's bytes vary. Full-payload/FIFO validation runs are separate from measured runs.
- Latency is the distribution of average write cost over groups of 1,000 writes. The table reports the arithmetic mean of five runs' p50/p99/p999 values. It is not individual-call latency or time to callback. The historical producer-write chart shows the mean p50; all five values are retained in the chart data.
- Throughput uses accumulated producer send time across rounds. Each round drains before the next; draining time is excluded, but copying/callback threads may contend during sending. Failed attempts, waiting and block switching stay in the send timing.
- TwoBufQueue includes layer-2 copying and an independent callback thread. Each layer has its own payload budget, so 8 MiB per layer means 16 MiB total. Native SPSC comparisons have one 8 MiB payload budget, including reserved slots/padding. Queue metadata, prepared input and other process memory are reported separately.
- Current-block scanning is disabled; publish count is
UINT32_MAX. There is no per-message flush. Tail handoff happens outside round send timing; Session acquisition and switching stay inside write timing. - For 256 MiB, callback loop work is calibrated against ordinary TwoBufQueue write to approximately 2–3 times producer wall time. The same loop count is then fixed for that length across all transports and Session. Their actual callback/write ratio can differ; the ratio is not a per-call callback latency ratio.
The p50/p99/p999 samples, CPU/RSS, backpressure, round counts and actual parameters are in each report. The finite sample count and timer granularity constrain tail interpretation. These conditions emphasize producer submission cost, not equal-thread-count or equal-total-memory competition.
7. Copy-constructor sensitivity
All implementations copy the complete variable payload. The ordinary copy constructor is bytes(other.bytes). ReaderWriterQueue 16/32 B uses a tagged CopyAfterZero constructor through the original try_emplace: default-zero the destination, then memcpy the full payload once; both operations are timed. Its 8/64 B paths retain member copying. rigtorp optionally requests a destination write-prefetch hint through its original try_emplace API, followed by one complete member copy, with no extra zeroing. These per-transport choices are fixed before timing and disclosed in each row and the complete parameters. See the rigtorp control and native copy control. Upstream headers remain unchanged and are checked against pinned hashes. The earlier independent A/B changes only the external message copy constructor; validation passes but results change markedly. The precise processor-level explanation has not been established.
The main table discloses per-adapter optimizations rather than enforcing one copy strategy: ReaderWriterQueue 16/32 B includes zeroing before copying, and rigtorp includes destination write prefetch. Rankings reflect external Payload code and compiler generation as well as queue algorithms. Historical A/B results are not mixed into the formal batch.
7.1 Earlier 16-byte follow-up before write prefetch
The follow-up uses the same two measured binaries and arguments: 8 MiB, callback iterations 0, 10 million messages per run, alternating constructor variants, five throughput runs and five latency runs per variant/queue. Four separate full-payload validation runs passed. Upstream queue implementations are unchanged.
| Queue | External Payload copy constructor | Throughput M messages/s | Group-average p50 ns |
|---|---|---|---|
| ReaderWriterQueue | Member initialization: bytes(other.bytes) |
97.12 | 9.308 |
| ReaderWriterQueue | Constructor-body memcpy |
480.01 | 1.292 |
| rigtorp/SPSCQueue | Member initialization: bytes(other.bytes) |
42.84 | 23.075 |
| rigtorp/SPSCQueue | Constructor-body memcpy |
368.86 | 2.608 |
These are arithmetic means of five independent runs per metric. The p50 is a quantile of 1,000-write group averages, not single-message or end-to-end latency. Complete commands, executable hashes and all 44 runs are retained in the summary, metadata and raw data. The original measured and variant sources are in the archives linked below.
This follow-up reproduced 16 B copy-constructor sensitivity. The rigtorp constructor-body memcpy restored throughput to approximately the earlier 363 M messages/s. ReaderWriterQueue p50 recovered to about 1.292 ns, but throughput near 480 M messages/s remained below the earlier 742 M messages/s. This is a pre-fix historical control; current main tables explicitly retain the ReaderWriterQueue 16/32 B zero-then-copy path. Hardware counters have not isolated the precise processor/compiler mechanism. An 8 B local improvement neither proves all lengths improve nor establishes such a large queue-algorithm advantage for TwoBufQueue. Current main reports were remeasured with the corrected program, without replacing results by historical scores. The rigtorp regression is removed through optional adapter-side destination prefetch; see the same-executable control and limits.
8. Reproduce and inspect
The runner records original source snapshots, executable/source/dependency hashes, compiler flags, commands, calibration and all trials. Resume requires identical inputs. Build with BRQ_BUILD_SPSC_BENCHMARKS=ON; dependencies are benchmark-only and explicitly downloaded by bootstrap_spsc.py, never by default configure. Follow the complete commands.
Formal raw data · environment · original measured source · copy-control raw data
The previous four-report matched experiment was measured from commit f698f25, which removes forced inlining from six benchmark lambdas while leaving the queue library unchanged. The 8 B regression evidence records the controls and limits. This run retains 400 independent formal measurements, 40 separate complete-payload/FIFO validations and 45 callback calibration runs; all completed successfully. The 256 MiB callback loop counts for 8/16/32/64 B are 1/1/2/4, shared across all transports and Session. Calibration ratios are 3.09/2.17/1.95/2.38; 8 B and 32 B slightly miss the 2–3 target and remain disclosed. Native controls are shared between ordinary/Session reports of the same cache size, so report counts cannot be added together. Exact measured-source hashes and the source archive are retained; scratch/report files explain the dirty worktree flag. Saved absolute command paths identify the measurement host, not portable instructions.
Regenerate the historical producer-write figure with Python 3.9+ and ReportLab 4.4.9:
python -m pip install reportlab==4.4.9
python benchmarks/spsc/plot_release.py --data docs/performance_data/release_20261011_inline_fixed_110024
The plot script reads the original two results files, exports SVG, and saves its numeric chart data. It does not run benchmarks or change measurement data.